
Field inspections and the use of field inspection data is a core functionality provided by the JunoViewer framework. Designed for use with Windows tablets, laptops, and desktop computers, the Field Inspection Tool (FIT) is an offline tool which enables you to assess treatment feasibility, and collect condition data and photographs, all the while viewing historical performance and trends. Additionally, the FIT is GPS enabled and also features one-click synchronisation of data to your database in the server.
Similar to the web element of JunoViewer, the FIT is a highly customisable framework and can be designed to suit the unique needs of each client.
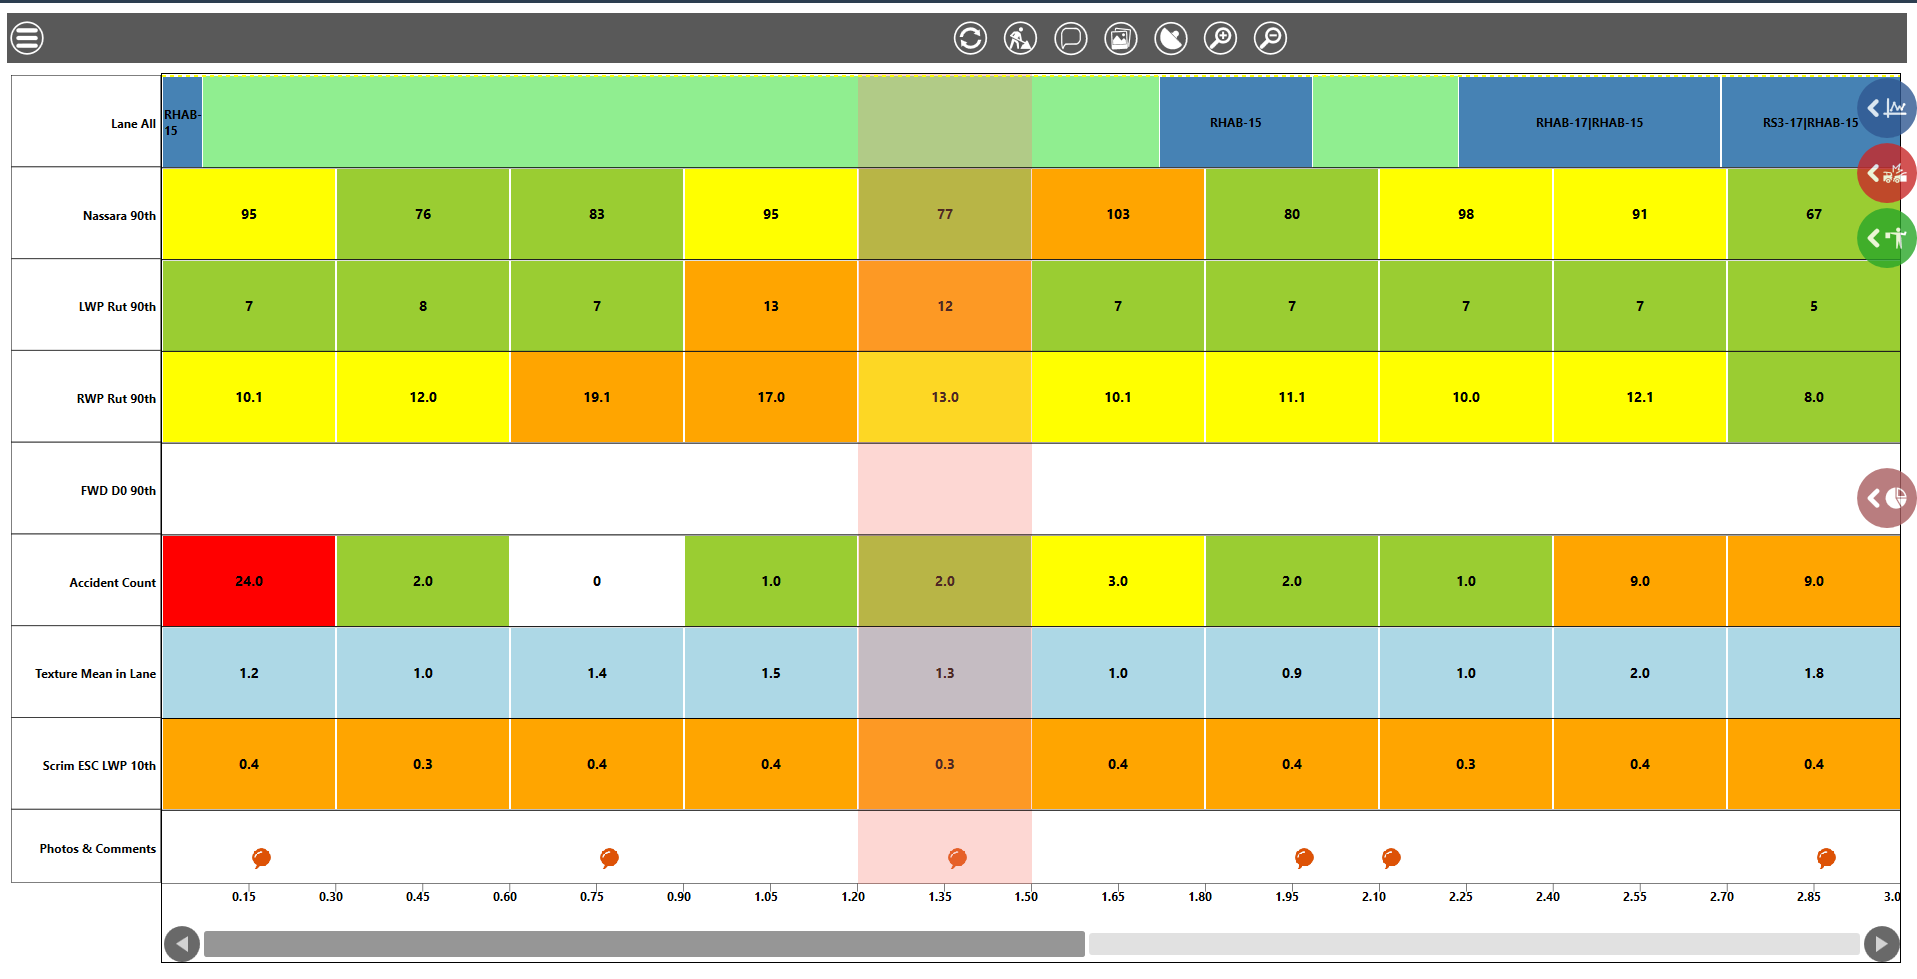
The day-to-day management of an operational Forward Works Programme (FWP) is a central element of the JunoViewer Web framework. JunoViewer addresses this through the highly innovative Forecast View. Through the Forecast View, a single, centralised copy of the FWP can be easily accessed, viewed, and modified through a web browser by any user with adequate permissions.
You can develop and store several FWPs for each network. This means you can have different versions of a FWP or have FWPs for different maintenance aspects (e.g. road maintenance and drainage).
Changes made to the FWP can be tracked, and when changes are made the predicted network condition is automatically re-calculated ensuring asset managers remain informed on the likely impacts of any changes in the FWP on future network condition.
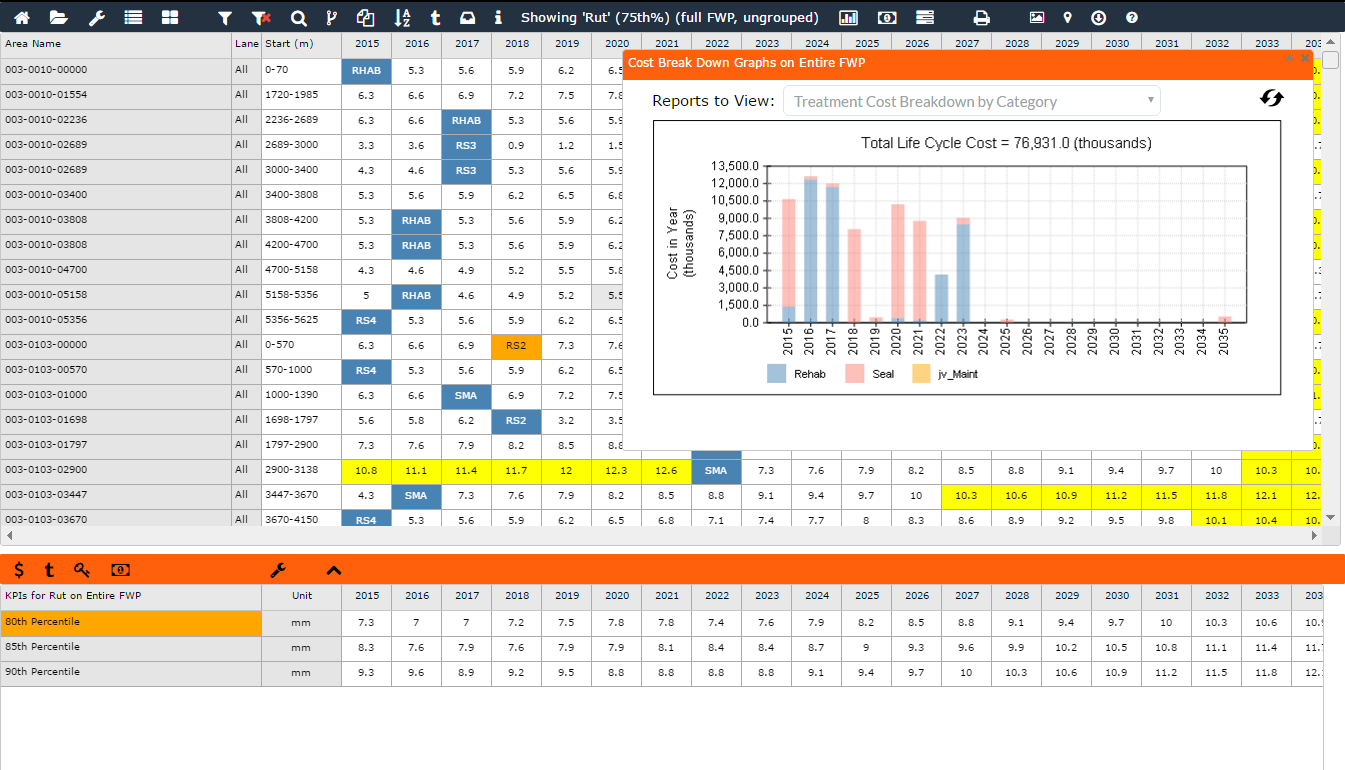
The JunoViewer framework provides powerful analysis and graphing features that can be combined to provide innovative, decision-supporting reports and dashboards.
JunoViewer users have the ability to generate excellent comparative reports, comparing customisable groups of data (referred to as Segment Groups) within a single network or across multiple networks. For example, a report group can be created to compare the performance of segments with different surfacing types, or projects constructed by different sub-contractors.
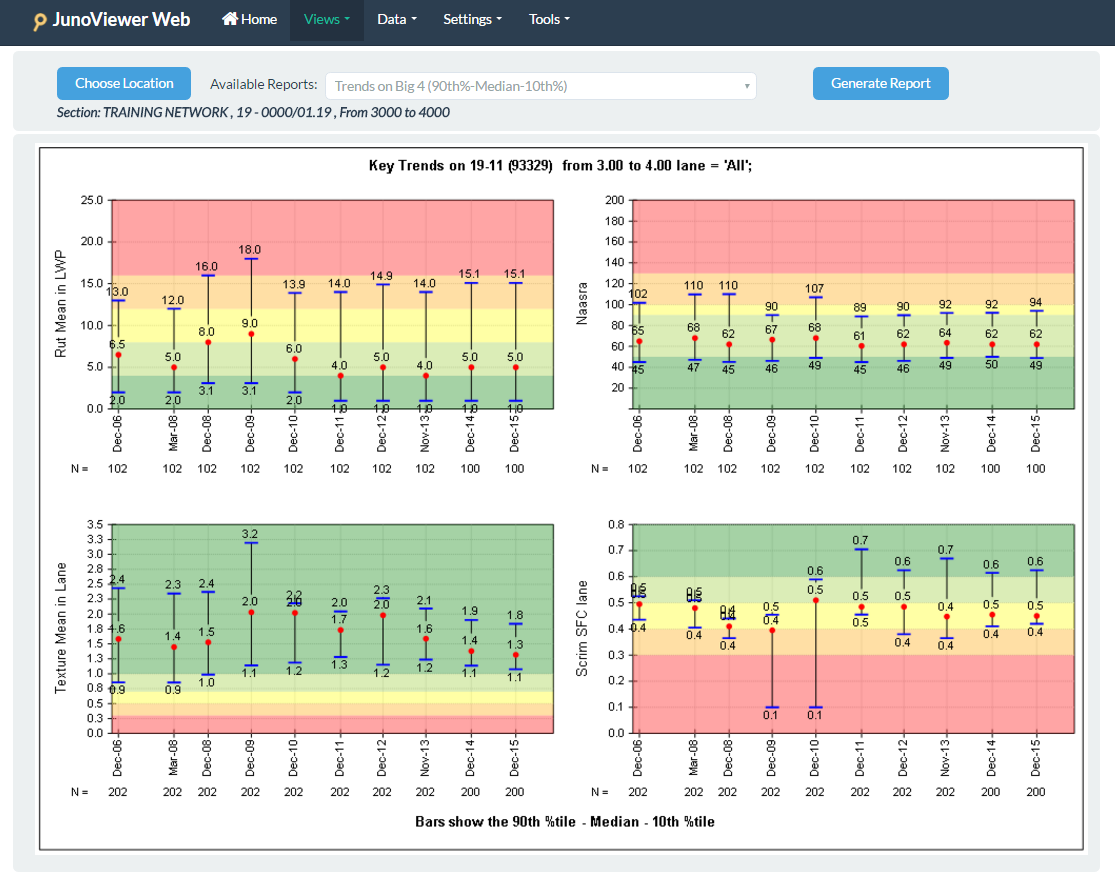
Trend analysis is another important innovation provided in JunoViewer Web. High-Low plots allow analysts to determine the rate of deterioration on various network condition parameters.
JunoViewer Web is equipped with useful tools enabling the accurate forecast modelling of a FWP.
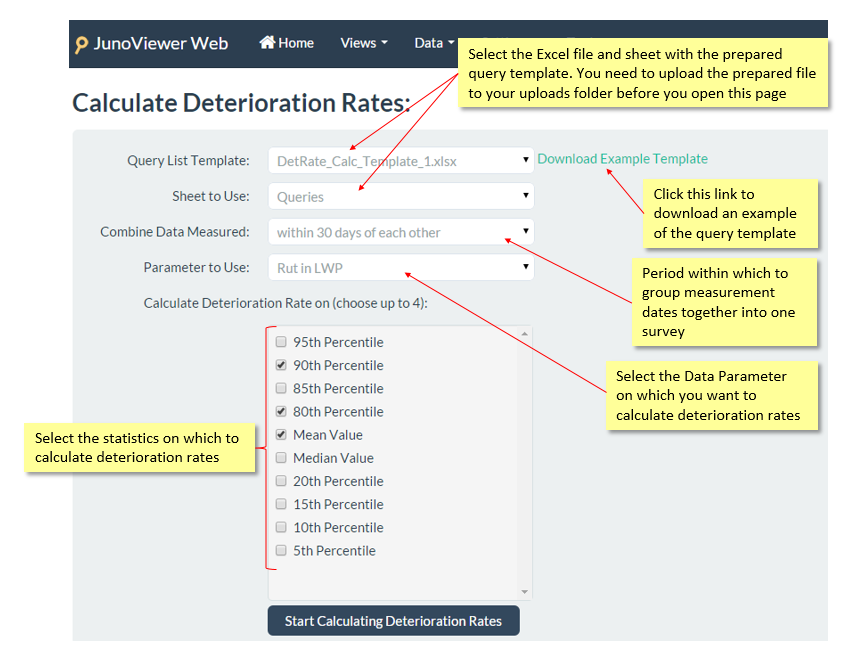
The calculation of deterioration rates is a basic task for those involved in deterioration modelling. The JunoViewer Deterioration Rate Calculator is an efficient and elegant solutions, enabling the user to calculate deterioration rates on any number of segments on your network.
The Reset Calculation Tool can be used to calculate the impact achieved by applied treatments on your network, by analysing the difference in the last survey before treatment, and the first survey after treatment.
For the forecast modelling itself, JunoViewer utilises the powerful and familiar syntax of the Excel environment through equations specified in our entirely customisable Deterioration Model Setup (DMS) Excel file to perform calculations that are relevant for each modelling segment. The concept of using Excel equations for this purpose is one of the key innovations introduced by JunoViewer Web, allowing users with varying experience in modelling to strike the “sweet spot” between model complexity and ease of model definition.
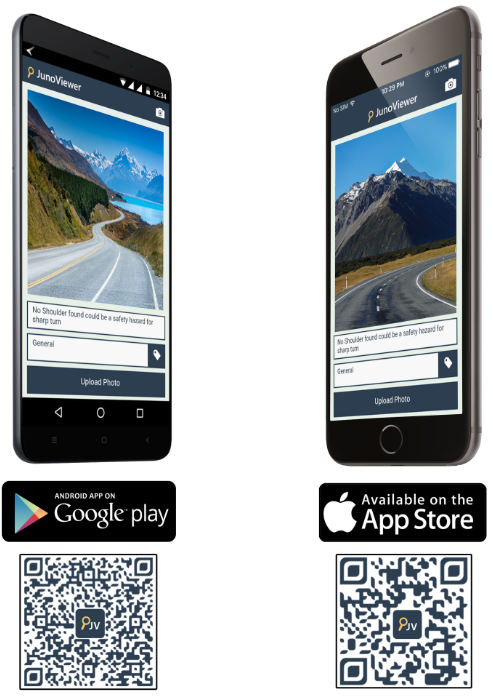
The JunoViewer Photo App is a free app available to all JunoViewer Web users from the Google Play and iOS App Store. Photos captured in the app are geo-tagged and after uploading to the server can be viewed within JunoViewer Web in the Forecast View and Map View, and are available for download via the Download Photos Tool.
JunoViewer Web looks and performs best when viewed in Google Chrome. However it will work well on all HTML5-compliant browsers currently available. This includes Internet Explorer 9 (and later), Safari and Firefox.