Features Overview

The JunoViewer framework includes the following key features that help our clients make informed decisions

web application junoviewer asset management

Web Application and Data Architecture

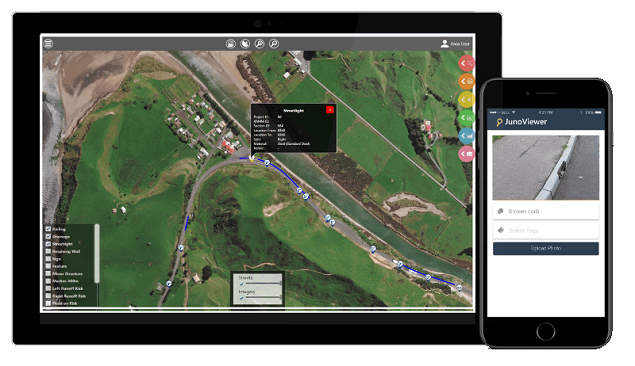
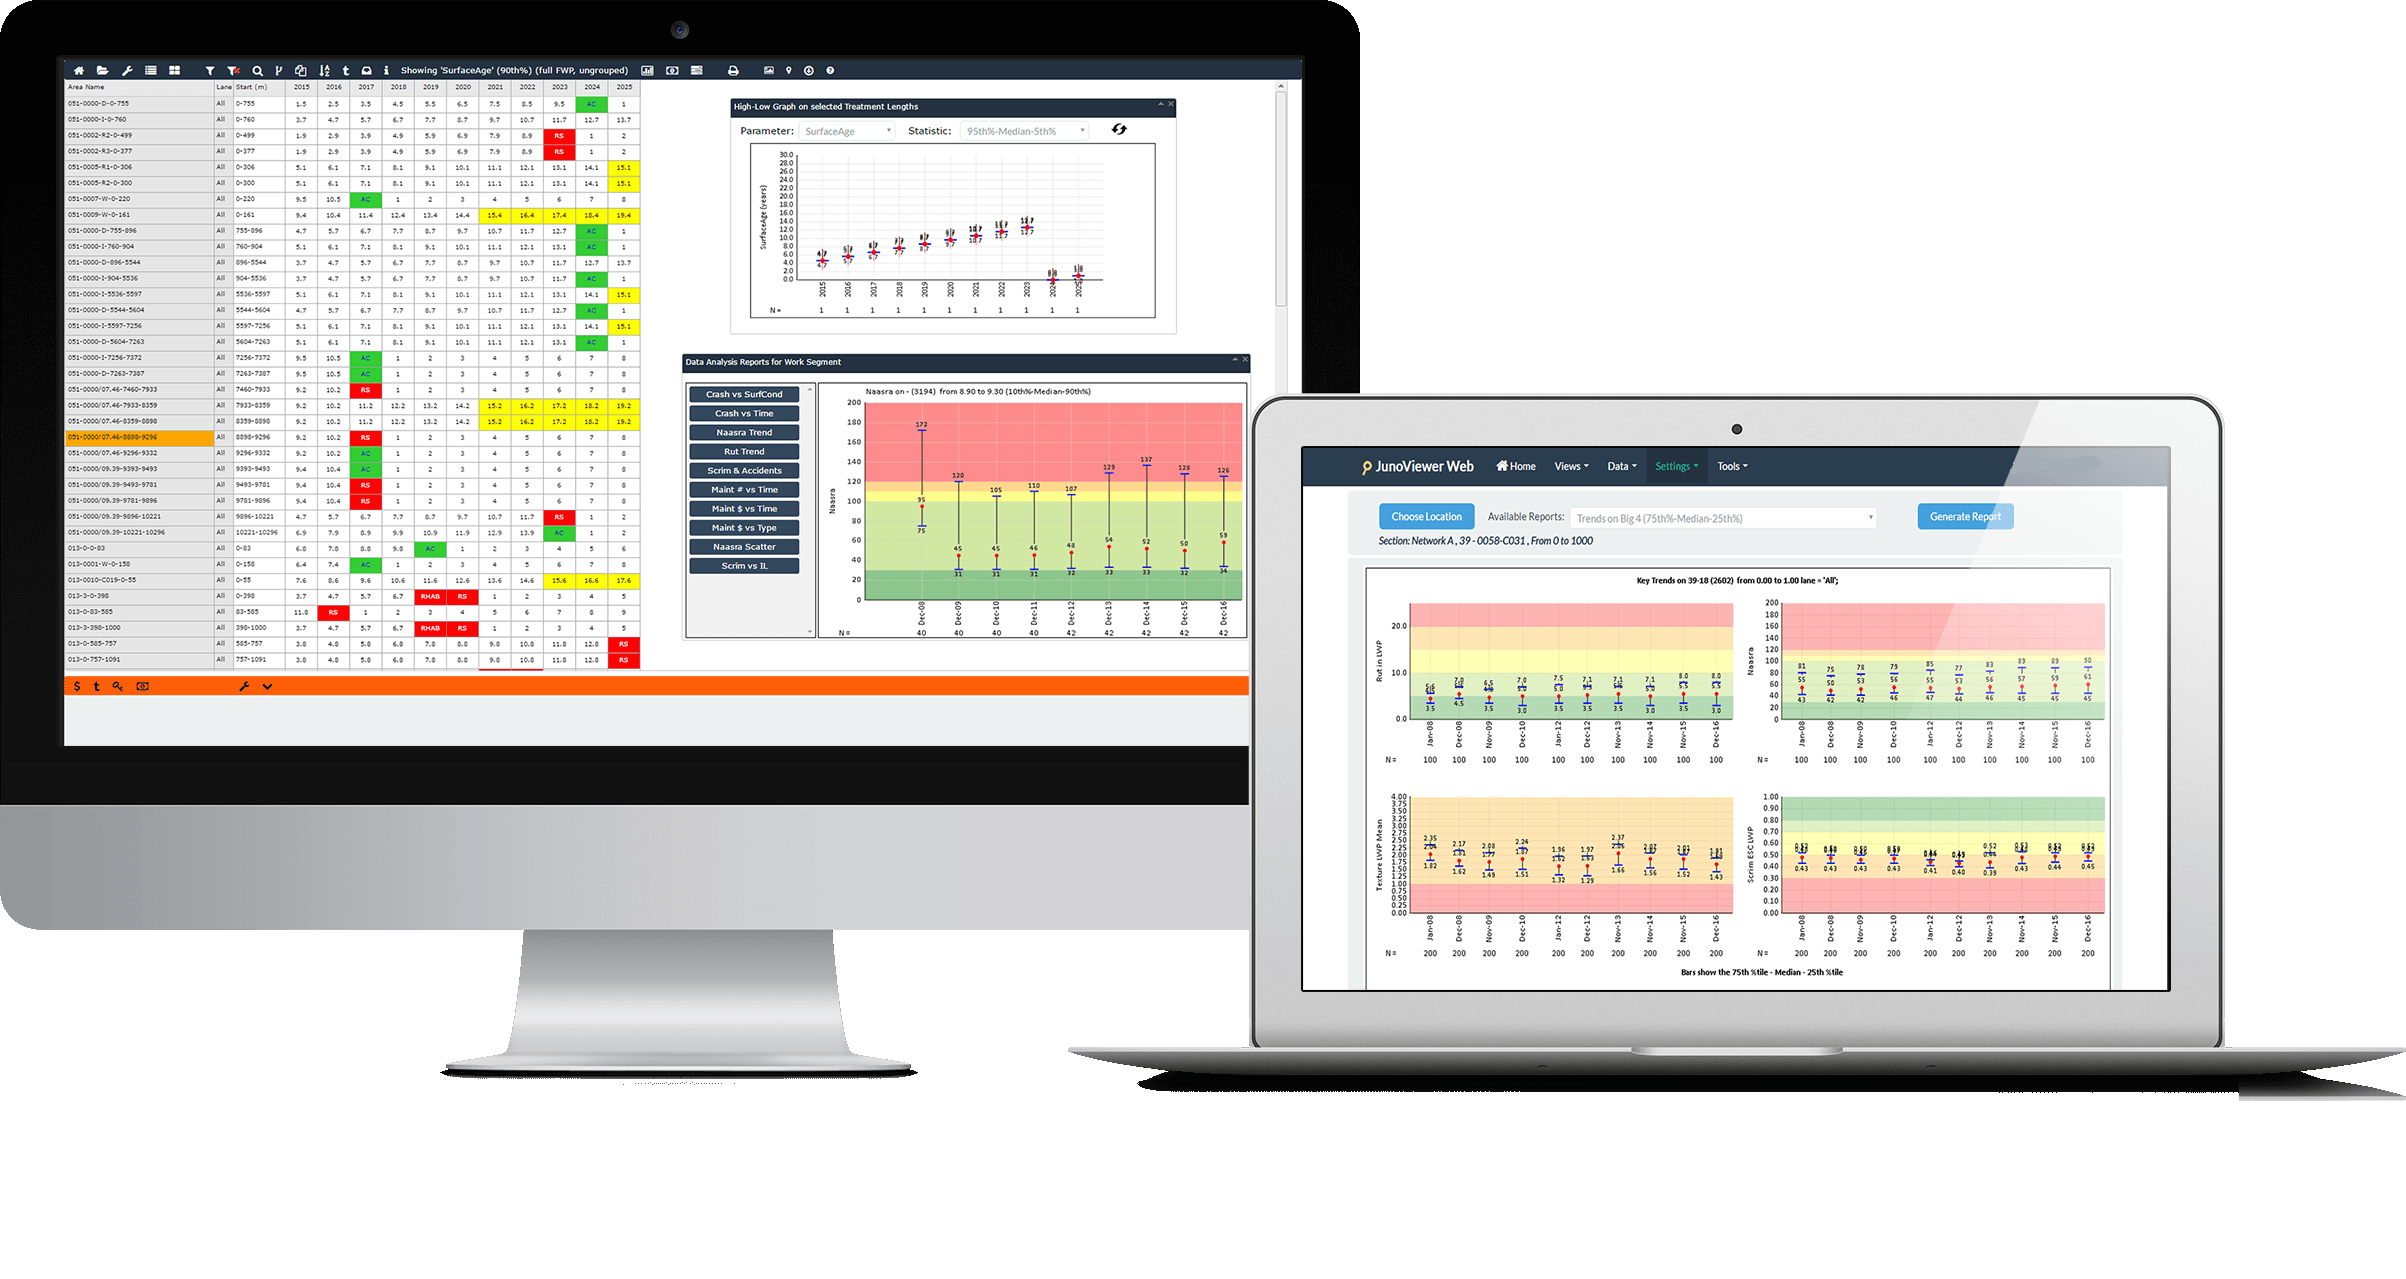
JunoViewer is built using modern web-based protocols supported by Microsoft Technologies. Our application is 100% browser based and truly zero footprint. It requires no installation of software on the user’s computers or plugins in the browser – operations that are difficult in a distributed government system

Key Features
Browser based, zero footprintTested for Google Chrome and Internet Explorer. Requires no additional plugins such as Silverlight or Citrix
Highly Secure - security certificate, hardware firewallHave passed penetration tests carried out by Government Agencies
Automated data backupsFull weekly backups, incremental backups 4-hourly; Backups are automatically transferred to a separate server in a different data centre
Flexible user administration and user rolesSystem administrator can add users and manage roles
Ability to link to external systems via web servicesRequires customisation to suit client needs
GIS / Mapping Engine showing treatments and assets with drill-down detailsGoogle map standard, ESRI (ArcGIS) maps can be provided on demand (requires customisation)
Online Help System and User ForumHelp is hosted online and can be accessed via a browser
Agency-specific Help ForumClient groups facilitate agency specific help materials, in any language, to be created (requires customisation and client interaction)
Multiple networks stored in a single databaseMultiple networks can be seamlessly accommodated, making this solution ideal for national/enterprise applications
Ability to link to external systems via web servicesRequires customisation to suit client needs
asset inventory junoviewer asset management

Asset Inventory and Condition

JunoViewer makes it easy for you to create and store inventories and condition data for any asset type. Once an asset class and its attributes has been defined, the table structures are automatically created for you. A quick workshop with Lonrix is typically needed to capture your needs for gathering field inspection data which can then be used to automatically create a mobile field inspection app. From here, you can set up and link algorithms to design inspection schedules, analyse budget requirements and create forward works programmes.

Key Features
Easy definition of Asset Classes and Attributes using Excel templatesUse our Excel template to easily define Asset Classes and Attributes to be stored. Our framework will then create the necessary tables.
Friendly and accessible help to migrate data from legacy systemsOur friendly and experienced support team will work with you to process and transform data from your existing legacy system into our database structure
Generate field inspection forms for Mobile AppsSit down with Lonrix to quickly design the field inspection forms to use for collecting field inspection data using our mobile app for the Android and Apple frameworks. Once done, the user interface is automatically created and will be available for use within days
Integrate photo and video dataThe JunoViewer framework includes cutting edge tools to incorporate video and photo data with other data (e.g. field inspection or high speed vehicle data). Use these features to create informative reports to drive decision making
Easily View Assets and Asset ConditionFrom our web platform you can easily show and select an asset type to drill down into available inspection data, including photos collected during inspections.
data analysis reporting junoviewer asset management

Data Analysis and Reporting

JunoViewer shines when it comes to making data trends visible so that it can drive informed decisions. Optimised for fast analysis of time series data, the framework can provide a wide array of graphs – either for individual segments, groups of segments or for entire networks.

To support our evidence-based approach to Forward Works Plan development, the framework also includes a comprehensive suite of tools to perform batch analysis of deterioration rates, treatment impacts and statistics. This makes it easy to calibrate and refine models.

Key Features
Time-Series analysis reports - fully customisableScatterplots showing surveys in different years, High-Low trend graphs
Batch analysis of deterioration trendsAutomated linear regression can be run in batch mode to analyse deterioration patterns, identify weaknesses and calibrate models
Batch analysis of treatment performanceAutomated analysis of before-and-after treatment trends can be run in batch mode to analyse impact and effectiveness of treatments
Batch export of segment statisticsBatch driven Excel export of statistics over time for a list of segments provided by the user
Project Performance AnalysisProjects details, together with as-built files, drawings etc. can be stored facilitate graphical analysis of long term project performance
Online stripmap - fully customisableShows data and planned treatments in a strip layout with instant click feedback to drill down into data
Batch stripmap generation and exportFully customisable stripmap layout design can be batch driven to create network wide stripmap reports
Video Analysis view with data and map interactivityRoad condition videos can be hosted centrally and viewed in the browser with map and data cross-referencing
deterioration modelling junoviewer asset management

Deterioration Modelling and Forecasting

Deterioration modelling is a core feature of the framework, and facilitates budget and treatment optimisation using established approaches such as the HDM models or later, more innovative approaches such as those based on Heuristics and Big Data analysis techniques.

The modelling architecture exists at two tiers. At the lower level is a suite of looping algorithms to optimise the allocation of funds based on optimal treatments. At the higher level is a modelling setup that the user can control. At this level, the user has full control over the model and can specify deterioration parameters and equations as well as the treatment selection algorithm.

Key Features
Modelling engine provides segment or segment group-based optimisation and ranking capabilityInnovative group-based optimisation and ranking engine is ideal for networks with multi-lane highways where lanes or sections need to be treated as a group (same time, different treatments)
User-definable benefit/ranking indexes and modelling parametersUsers can design and implement their own model parameters and benefit functions
User-definable deterioration models/equationsHDM models or more locally developed models can be defined by the user. Any number of model parameters can be defined
Treatment or Strategy based optimisation using Heuristics and/or Cost-Benefit Analysis IndicatorsRequires some customisation and setup to suit client-specific needs
Flexible, user-defined Treatment Selection AlgorithmUsers can define rules and rule sets for Treatment Selection. A unique feature is the optional use of a user-defined Pavement Design Catalogue
Budget scenario analysis featuresUsers can define budgets and analyse future network condition over different budget scenarios to identify and optional budget
forward works programme junoviewer asset management

Forward Works Plan Management

The day-to-day management of Forward Works Plans (FWPs) is an integral part of the framework. Our innovative Forecast View allows network managers and central planners to quickly see where and what work is planned. The FWP Summary view can be used to quickly see a summary of future costs and forecasted network condition.

Key Features
Innovative, centralised view of FWP in the browserUsers can modify treatments on the fly - future condition is immediately remodelled and displayed
Full audit trial of modifications made after modellingRole based permissions control who can change the FWP. All changes are logged for audit purposes
Quick aggregation and of FWPs for multiple networksIdeal for national budgetting exercises where multiple FWPs have to be aggregated and analyzed
Seamless sync to offline field inspection tools for FWP ValidationExport your FWP to our award-winning Field Inspection Tool (FIT) for field validation and refinement of the FWP
Field inspection data audit before finalising changesManagers can view and approve or reject field changes to the FWP before changes are merged into the online database
field inspection tool junoviewer asset management

Offline Field Inspection Tools

Field Inspection Tool

The JunoViewer offline Field Inspection Tool (FIT) is one of the features most used by our clients. The FIT facilitates field inspections and validation/refinement of Forward Works Plans during field inspections. As such, the framework is one of the few systems that includes seamless integration of centrally held FWPs and offline validation of the FWP

Smartphone App

The framework also provides a platform for field inspections using smartphones and tablets. Clients can specify the properties and layouts of field inspection forms. These templates are automatically downloaded to the Android app to configure the user interface during field inspections. Data, including photos, are seamlessly synched back to the central server.

Key Features
Award-winning Field Inspection Tool (FIT) to capture and sync inspections while displaying historical dataFIT facilitates export of one or more FWPs to an offline application (windows) for GPS aware field inspections (currently Windows based)
Android Phone App for logging field inspectionsFully customisable to suit your asset features and inspection form templates
GPS aware to facilitate location in the fieldUsers can quickly find where they are using our GPS lookup features
GPS Centreline data capture tool, with auto sync-to-serverCapture GPS data while driving using our Field Inspection Tool. Ideal for developing countries where road centreline data is not always available
ESRI Map capable in offline modeCustom developments can include ESRI Maps in offline mode (end-user organisation needs ESRI maps license)
Quick capture of photos while offline, sync to server when online againAndroid or iOS Platforms. Photos can be tagged and commented. Once synched to server, they can be shown on a map or in reports
video analysis junoviewer asset management

Video Analysis View

The Video Analysis View allows users to see a video and graphs relating to that area in their network side by side.

Key Features
Stream from within the browserNo need to deal with video files on your computer. The videos are streamed through the web
Automatic scrollingThe focus moves accross the strip map as the video plays
Compare historical videosSwitch between multiple videos recorded in the same section to see changes over time